To get started, if you haven't done so already, download MyQuery and install it, and make sure to install the plugins / User defined tools. Once you have done that we are sort-of ready to go, but first a few words pf caution regarding the sourcecode.
If you haven't used any of the NDB low-level APIs, i.e. NDBAPI and MGMAPI, let me fill you in on a few details. NDBAPI is used for normal database DML and DDL, but it is much more low level than SQL, but also much MUCH faster. NDBAPI is strictly a C++ interface, although there are other bindings (Java) on top of it. MGMAPI on the other hand, which is used for monitoring and managing an NDB Cluster, is C on the surface, meaning the the interface used no classes, no overloading no nothing, and most MGMAPI code I have seen uses straght C. Bit this isn't the whole truth. Some NDBAPI includefiles that are also needed by MGMAPI still have no C++ specifics, but one thing it uses, which is valid in C++ but not in C, is to define structs with no members (don't ask me why), like this:
struct ndb_logevent_STTORRYRecieved { };
So even though the MyQuery plugin that I will show later is written in C and is contained in the file NdbMonitor.c, it still must be compiled as C++ code. In Visual Studio 2008, this is done by right clicking on the file in Solution Explorer (yes, the file NdbMonitor.s, nit the project, that will not work!) select the Properties menu option and in the dialog go to C7C++ and then Advanced and then change Compile as to Compile as C++ Code. Also, when you look at the MyQuery Solution, note that the NdbMonitor project is compiled and linked against MySQL Cluster, and in fact, this is not the binary MySQL Cluster that you download from MySQL, rather this is built from source, see more in my previous blog postings on the subject.
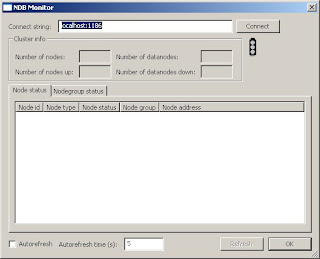
OK, so that's it for the sourcecode, now let's look at what this little puppy can do when we run it (and it's part of the biinary MyQuery download by the way, so you do not have to use MGM API yourself or anything). To use this tool, after installing MyQuery, connect to an SQL node in a NDB Cluster and then select the Tools->NDB Monitor menu option. This will show a dialog like this:
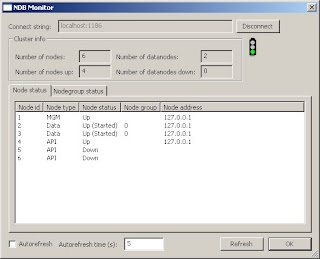
 If this is the first time you use NDB Monitor, the default Cluster connection string is filled in the connect string edit box, and adjust this to reflect your NDB Cluster setup. You may connect to NDB Cluster on any platform here, not just Windows. Then click Connect and the current Cluster status will be shown when you have connected to the Cluster:
 Most of the information here should be pretty obvious. The traffic lights are green if all datanodes are up, yellow if one is down and red if two or more are down. To refresh the status click Refresh and you may automatically refresh by turning on the Autorefresh checkbox and enter the number of seconds between refreshing.
There are two tabs, one for the nodes themselves and one for the node groups. When the node view is active, you can right click on a node to bring up a menu that allows you to do one of three things:
- Stop a node - This will bring up a dialog that allows you to stop a node, gracefully or just kill it.
- Restart node - This will bring down a node and then restart it. You have the option of leving it in "non-started" mode also.
- Start node - If you have done a restart and left a node in non-started mode, then you can start it using this menu option.
- Cluster backup - This is not that hard to implement, I just haven't gotten through to it yet.
- Cluster log management - This is a bit more difficult, but it involves subscribing to the cluster log and showing log contents in a new tab.
/Karlsson
