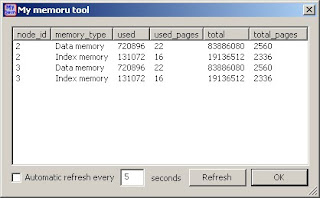
There are 2 predefined tools that support MySQL Cluster there, one that uses the ability to predefine a SQL statement that runs in a non-modal dialog and is optionally updated and one that uses the feature that allows a DLL, using a sepcfic MyQuery API, to run as a tool, and in this case, this tool is linked up with the NDBAPI to allow monitoring and a certain amount of control overthe Cluster.
Monitoring NDB Cluster memory usage
In MySQL Cluster / NDB 7 and up, there are tables in a schema specific to NDB, called ndbinfo that includes a bunch of tables with NDB specific information.
Defining a tool in MyQuery that monitors memory usage, like this tool. by selecting from a table is real easy. The Memory usage monitor is included with MyQuery 3.3 and up, so you can just download MyQuery and then connect to the Cluster and use it, but possibly you want to create tools of your own for other ndbinfo tables or something completely different.
Assuming we didn't have the NDB Menory tool already, and wated to create it, this is how you wold do that:
- First, test the SQL statement you want to use in the MyQuery editor. Always use fully qualified table names (i.e. prefixing them with the database name), unless you have a specific reason not to do this. In this case, we end up with this statement:
select * from ndbinfo.memoryusage - The next step is to create the tool. Select the Settings -> Configure user tools menu option, and you will get a dialog that shows all the tools that are currently defined. We are to create a new tool, so click the new button.
- In the dialog that pops up, give the tool an appropriate name and select a type. In this case, the type is SQL SELECT. Then click OK.
- A new tool is now created for you, but it will not be saved until we have added some required info, in this case teh SQL statement. In this case, if you have the SQL text in the editor, click the Copy button and select Copy from editor, else just tpe in the SELECT statement you want to run.
- We probably want to tool to be shown in the Tool menu, and hence be accessible, only when it will work properly, in this case, the ndbinfo plugin is required. For this, select the Enabled for plugin radio button and then select the ndbinfo plugin in the listbox.
- The last thing we want to do is select the connection to use. There are three options here: Use the connection used to execute normal SQL in MyQuery (Use execute connection), use the connection normally used by MyQuery tools (if MyQuery isn't connected with dual connections, then these two options are the same of course), which is the default (Use main connection) or use a completely separate connection. In our case, just use the default.
- For tools like this, you would usually not enable the Modal dialog option. This is an option only used in certain special cases.
- Finally, you might want to add some Help text.
- That's it, now we have a new tool! Click OK and you are done!
 As you can see, there is the ability to refresh the contents automatically, to refresh every 2 seconds, just check the Autimatic refresh checkbox and set the time to 2 and you are all set. Let me know if you find out any really cools ways of using this feature for tools, and if they are generic enough, I will include them in a future release of MyQuery.
Happy Clustering!
/Karlsson
No comments:
Post a Comment